
The Raspberry Pi has now been fitted to the Bioloid using some spare brackets and sponge padding.


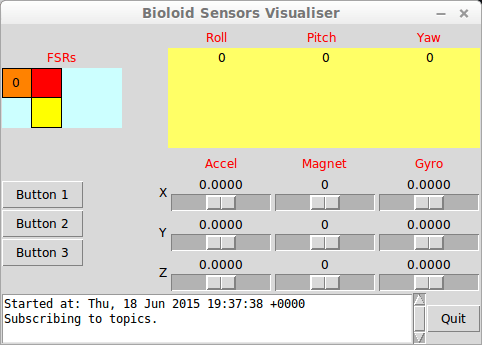
A GUI for the Pi’s screen has also been made using Python, Tkinter and the rospy library. This is actually my first Python program from scratch, so it’s far from perfect but it’s simple and does the job for now!
The program visualises the sensor data from the force sensors and IMU, which the Arduino is publishing on ROS topics. The slider values are unfiltered data, the same which is used by another ROS node to fuse the IMU data and provide a good estimate of the torso’s 3D orientation. The roll/pitch/yaw widgets are used to visualise a simple transformation of the accelerometer/magnetometer data, as was performed previously here. The force sensing resistor (FSR) widget is not active, as the resistors have not been wired in yet, but eventually each FSR’s value will be visualised with a coloured square box ranging from yellow (un-pressed) to red (fully pressed).
-
- Sensor visualiser in Python. ROS topics not being published, current work-in-progress.
-

- Sensor visualiser in Python. ROS topics found (FSRs, accelerometer, magnetometer and gyro data).
