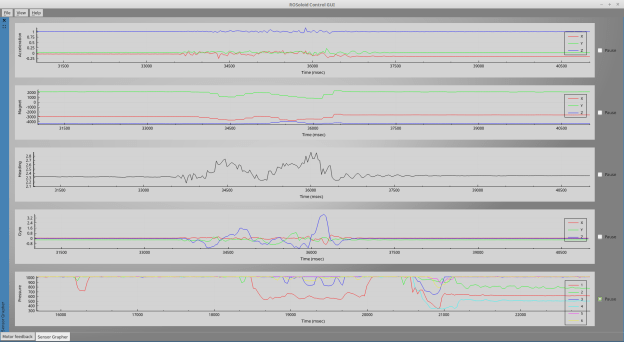
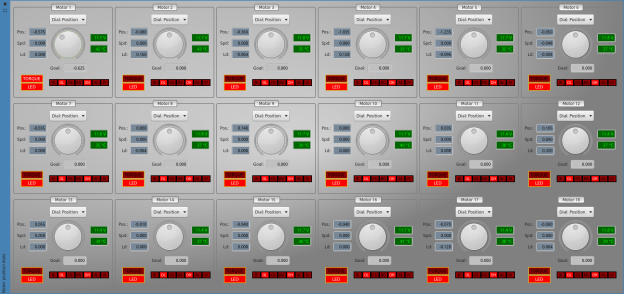
I have made some updates to the motor dials which control the motor positions. They can now change mode and control motor speed and load. Also, the GUI is regularly updated with some important feedback from each motor: motor voltage and temperature, LED and torque on/off state, and feedback on all the alarm states.


At this point I’m starting to think that an internal model of all the motor control table data would be useful at this point! Rather than classes making direct requests to the motor controller to receive motor information, all the state data could be kept by the controller and updated regularly. Classes would then simply get the latest data from this model when needed. This is however partially the way the controller works already, as it has a model of the ROS-style joint states which hold present positions, present speeds and present torques (loads), as well as goal positions, moving speeds and torque limits. The joint states are published continuously by a ROS publisher. Present and goal positions are the most important data, as the AX-12 by default only performs position control. Moving speed is simply the speed that the motor will use to move between positions, so cannot be used for e.g. a velocity feedback loop. “Torque” is a bit of a misleading term here, as there is no torque sensing in the motors. Torque sensors are only available in much more expensive motors than these. The load values reported by the AX-12 are related to the motor current, but cannot be read while the motor is actually moving. Two notable sources which have more detailed information on this somewhat unclear measurement can be found here on the RoboSavvy forum and here.
I think I’m done with updating these graphical widgets for the time being, as it is detracting from the main goals of exploring MoveIt! and getting the robot walking.