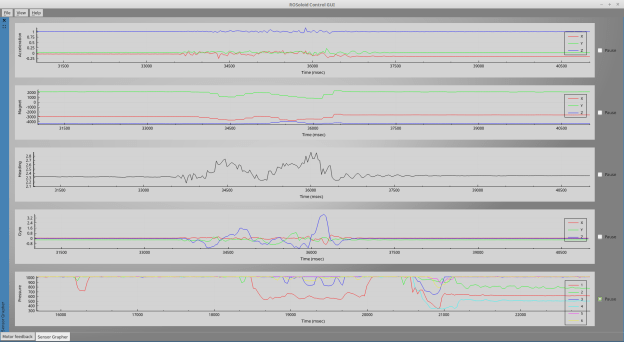
A sensor plotting window has now been added to the GUI, which shows all data from the IMU and pressure sensors. The accelerometer, magnetometer, gyroscope, heading data and Force Sensing Resistors’ (FSRs) data are all published as ROS messages as shown in this post, so reading them in the Qt GUI is fairly straightforward, in a similar way to how the joint states are being read. The graphs are made using a third party library for Qt called QCustomPlot.
Each graphs show a scrolling 10 second window of buffered data, which can be paused/played. With QCustomPlot it’s easy to enable user interactions with graphs (drag axis ranges with mouse, zoom with mouse wheel, etc.), so I enabled this option whenever the graph is in a paused state.
The y-axis units are currently showing raw data, which I will probably update to show standard values.

A useful thing I found in Qt with QDockWidget, which is used to create dockable/floating sub-windows, is that these widgets can also be tabbed to save space on the screen. How can this be done in code you may ask? The useful functions I found were: setDockNestingEnabled() (or setDockOptions()), tabifyDockWidget() for QMainWindow, and raise() to select the default tabbed dock widget you want displayed.
That’s pretty much all there is to the sensor grapher. I might add more features to it in the future, but for now it does the basics!
